Building Marquis
Every time The Lafayette Company earned a piece of media coverage, someone pasted the link into Slack, then into a spreadsheet. That was the whole system.
The spreadsheet was a log. No way to tell if sentiment was shifting, no view across sources they hadn’t found yet, just whatever ended up in a cell.
My wife founded The Lafayette Company in 2015. Eleven years in, she’s built it into a seven-person PR firm in Alexandria. I handle their IT, which means I’m in their Slack and I see how the work flows. One evening I asked her whether automated news collection would be useful.
She said sentiment was the main thing. Whether a client got covered, they already knew. What she couldn’t see was whether the tone was positive or negative, and whether it was moving in a direction they should care about. Beyond that, why were they building reports by hand when a machine could do it? And they were missing coverage from sources that weren’t already landing in Slack.
They already had media monitoring software. It found clips and filed them, and that was where it stopped. It couldn’t tell you whether sentiment was shifting, and nobody was getting a report out of it. The missing piece was analysis.
So I started building.
Marquis collects from news APIs and RSS feeds across more than 150,000 sources via EventRegistry, Google RSS, and GDELT. It runs on a schedule, scores sentiment from the news APIs, calculates earned media value, and stores everything. When a report is due, it builds one and drops it into Slack and cloud storage, so nobody has to go looking for it.
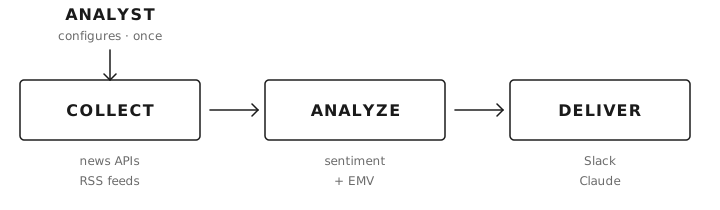
The main interface is Claude. Analysts tell Claude which clients to monitor, what topics to track, how often to run. A Claude plugin handles the setup. When they want to understand what’s happening with a client’s coverage, they ask. Claude fetches the data and talks about it. You can ask why sentiment dropped in a particular week, or how the last month compares to the quarter before, and you get an answer instead of a chart.
There’s a web interface too, and it does quite little on purpose. It’s an observability tool for the visualizations and portfolio views a text conversation is bad at. The input layer stays in the chat.
I built the whole thing in about two months of evenings and weekends, most of it written on my phone. If that sounds implausible, I wrote about how the setup works.
The pilot ran last week. The first automated report came back in a few minutes. The same report would have taken several hours to assemble by hand. The main open issue is cold start latency on low-traffic endpoints. As of this week, the firm is running on it.